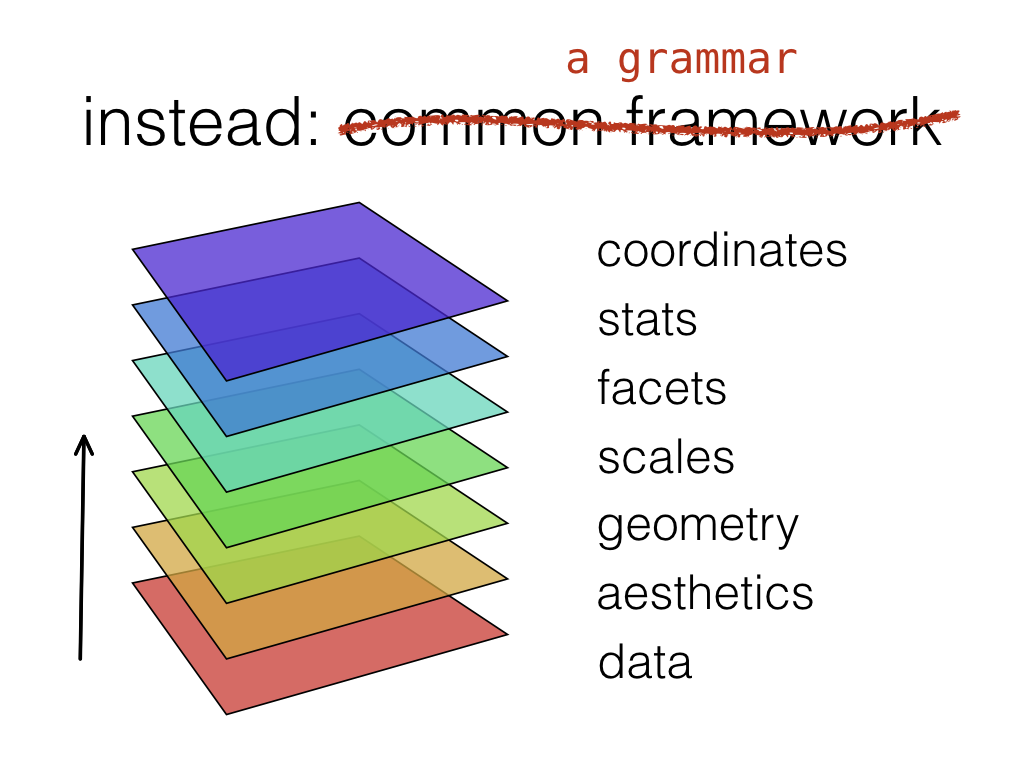
I finally got around to reading some of Hadley Wickham’s papers, including A layered grammar of graphics[PDF] about this implementation of ggplot2 in R. As a long-time Matlab user, thinking about visualising data in this declarative way seemed quite alien. But I quickly discovered how powerful this approach is for exploring complex data sets.
In a recent journal club, I presented some of those ideas to students and colleagues in our research group. A brief (non-verbal) overview of some of the ideas is available in my slide talks here [PDF].
If you aren’t quite ready to kick your Matlab habit (or your boss won’t let you), go and check out Pierre Morel’s excellent GRAMM toolbox at https://github.com/piermorel/gramm. It’s a clever way to achieve pretty much the same workflow as with R/ggplot2 - but from within Matlab. People in my lab have already used it with much success.
Enjoy.
Github gist
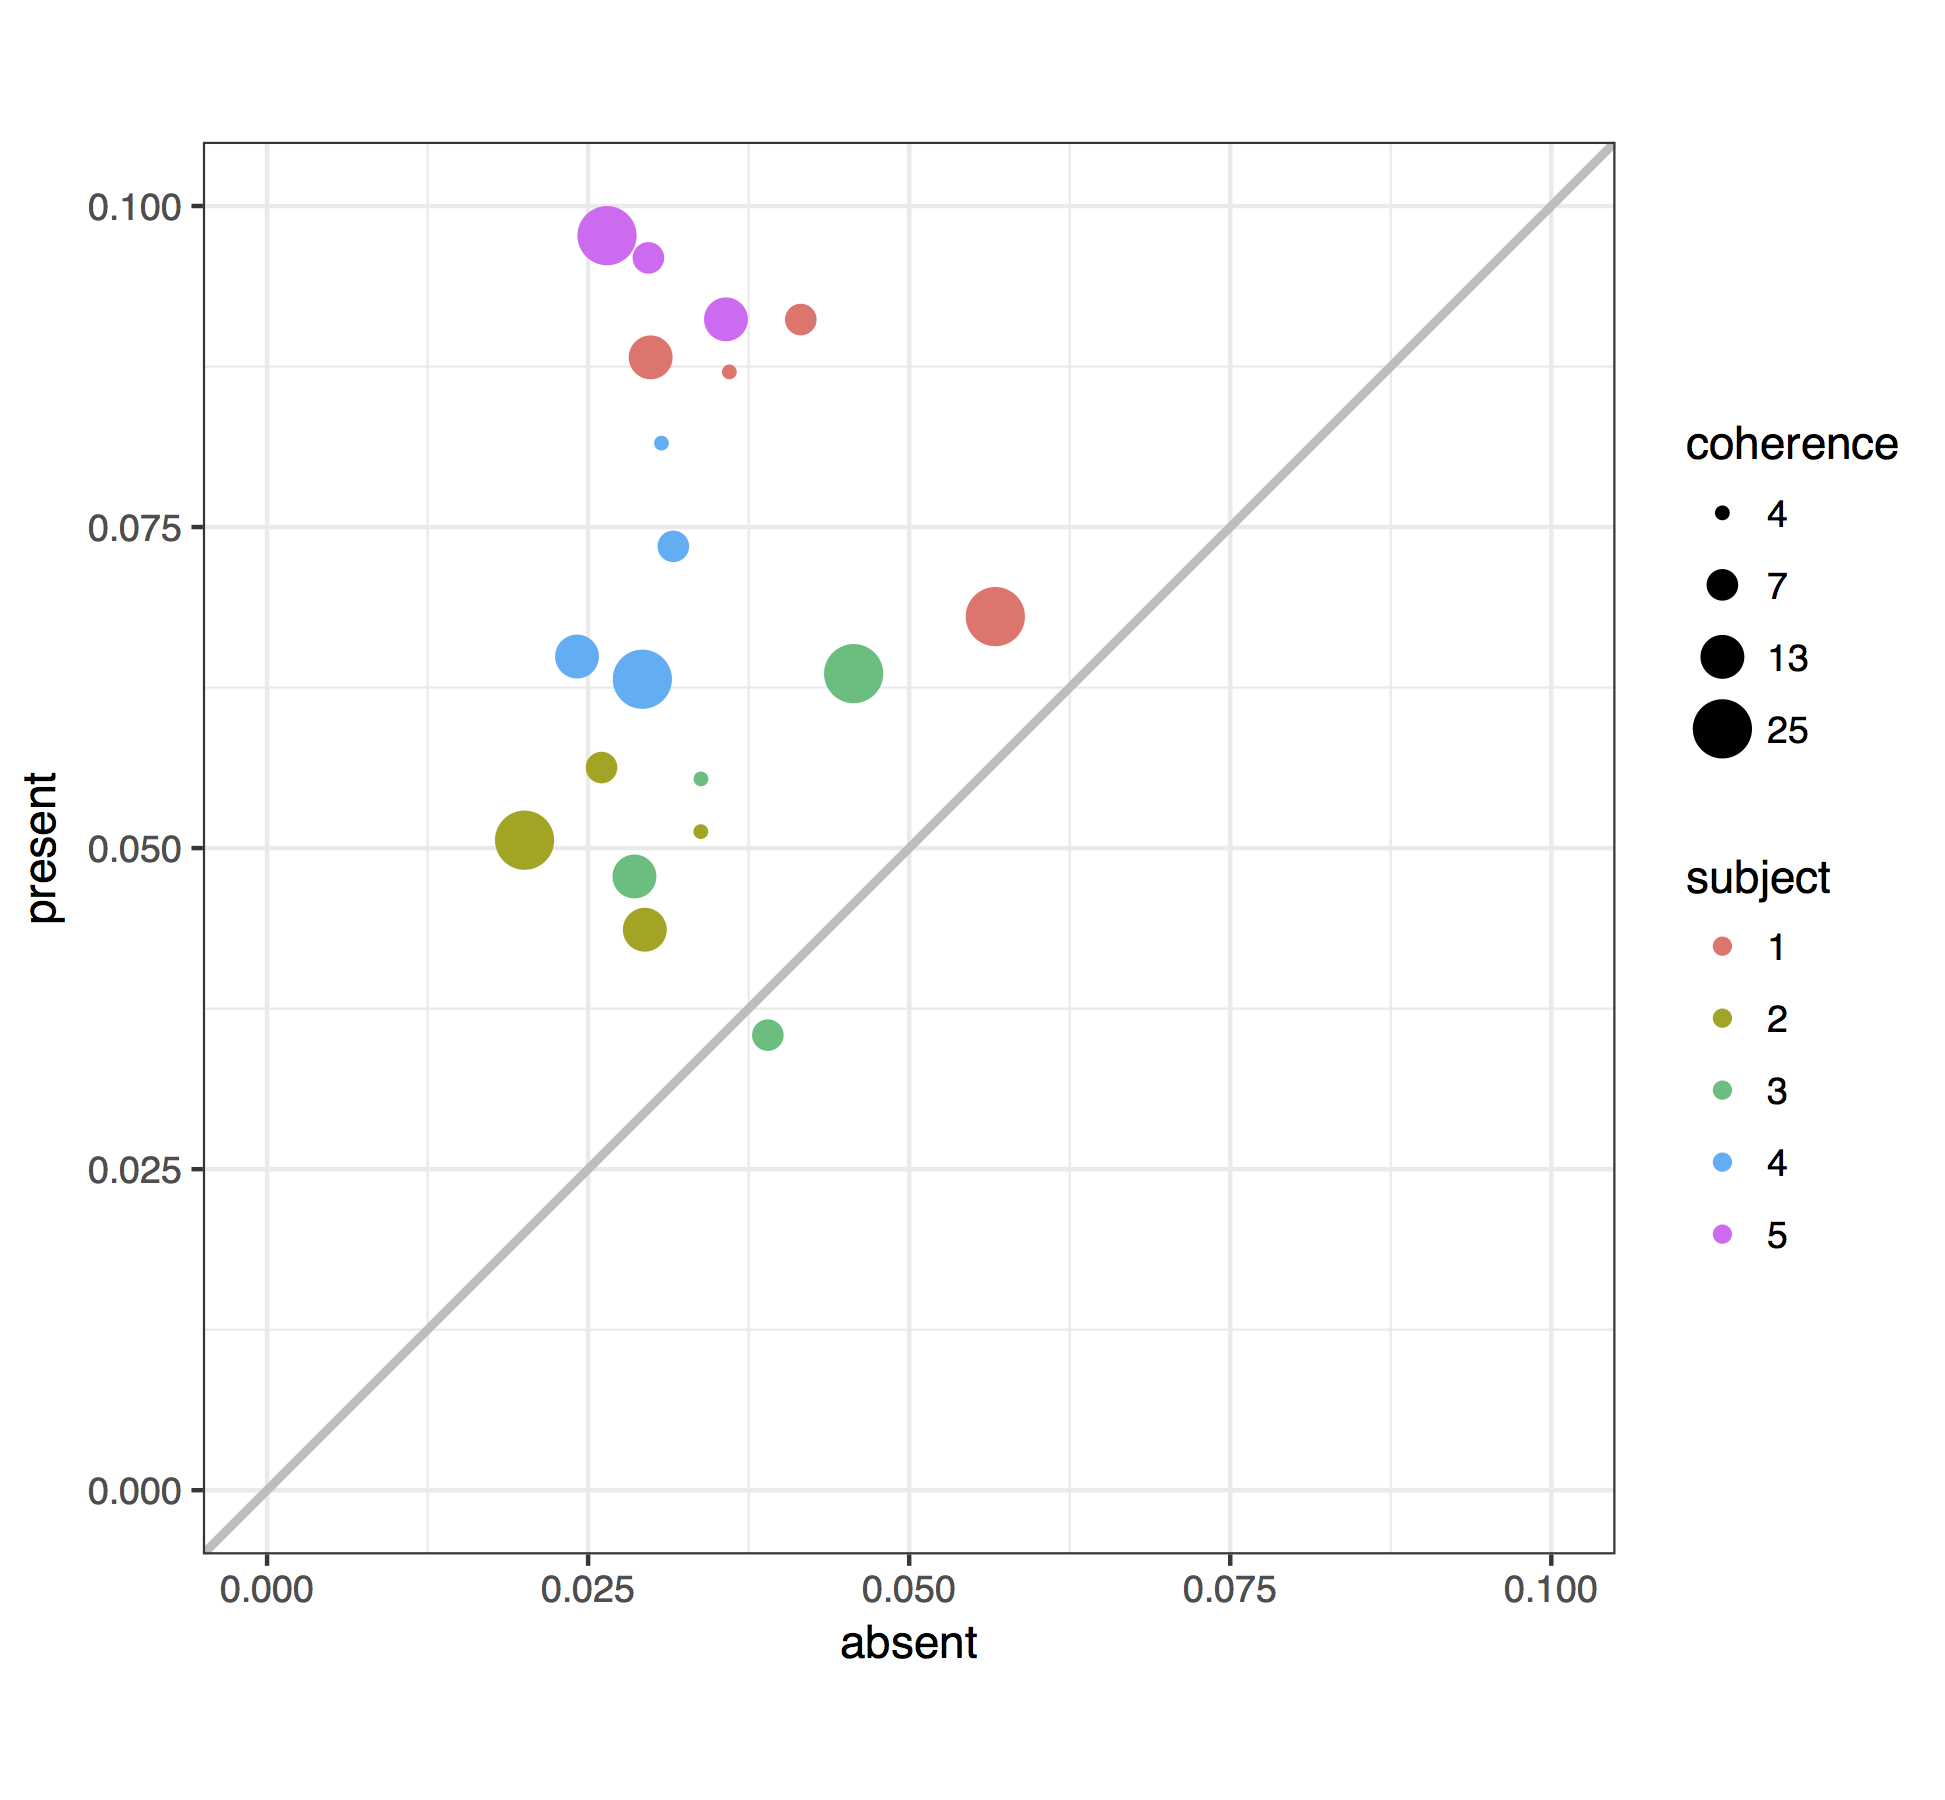
You can find some very simple code examples of how to re-create a plot from a recent paper by my graduate students (Figure 3b, Zamboni et al, 2016) [at this gist].